
Indicator Script Form ChatGPT
Script trade from ChatGPT
Ready to embark on your Binary Option trading journey with a Trusted Broker?
Begin with confidence at IQ Option.
Register to open an account at : https://sornwinth.com/web-ai-script
Starting point
Having taught beginners trading techniques through several videos, whether on a computer or mobile device,
to identify rejection signals associated with both the upper and lower Bollinger Bands, I have utilized simple patterns such as the "hammer" for easy recognition by beginners.
Example of the sought hammer
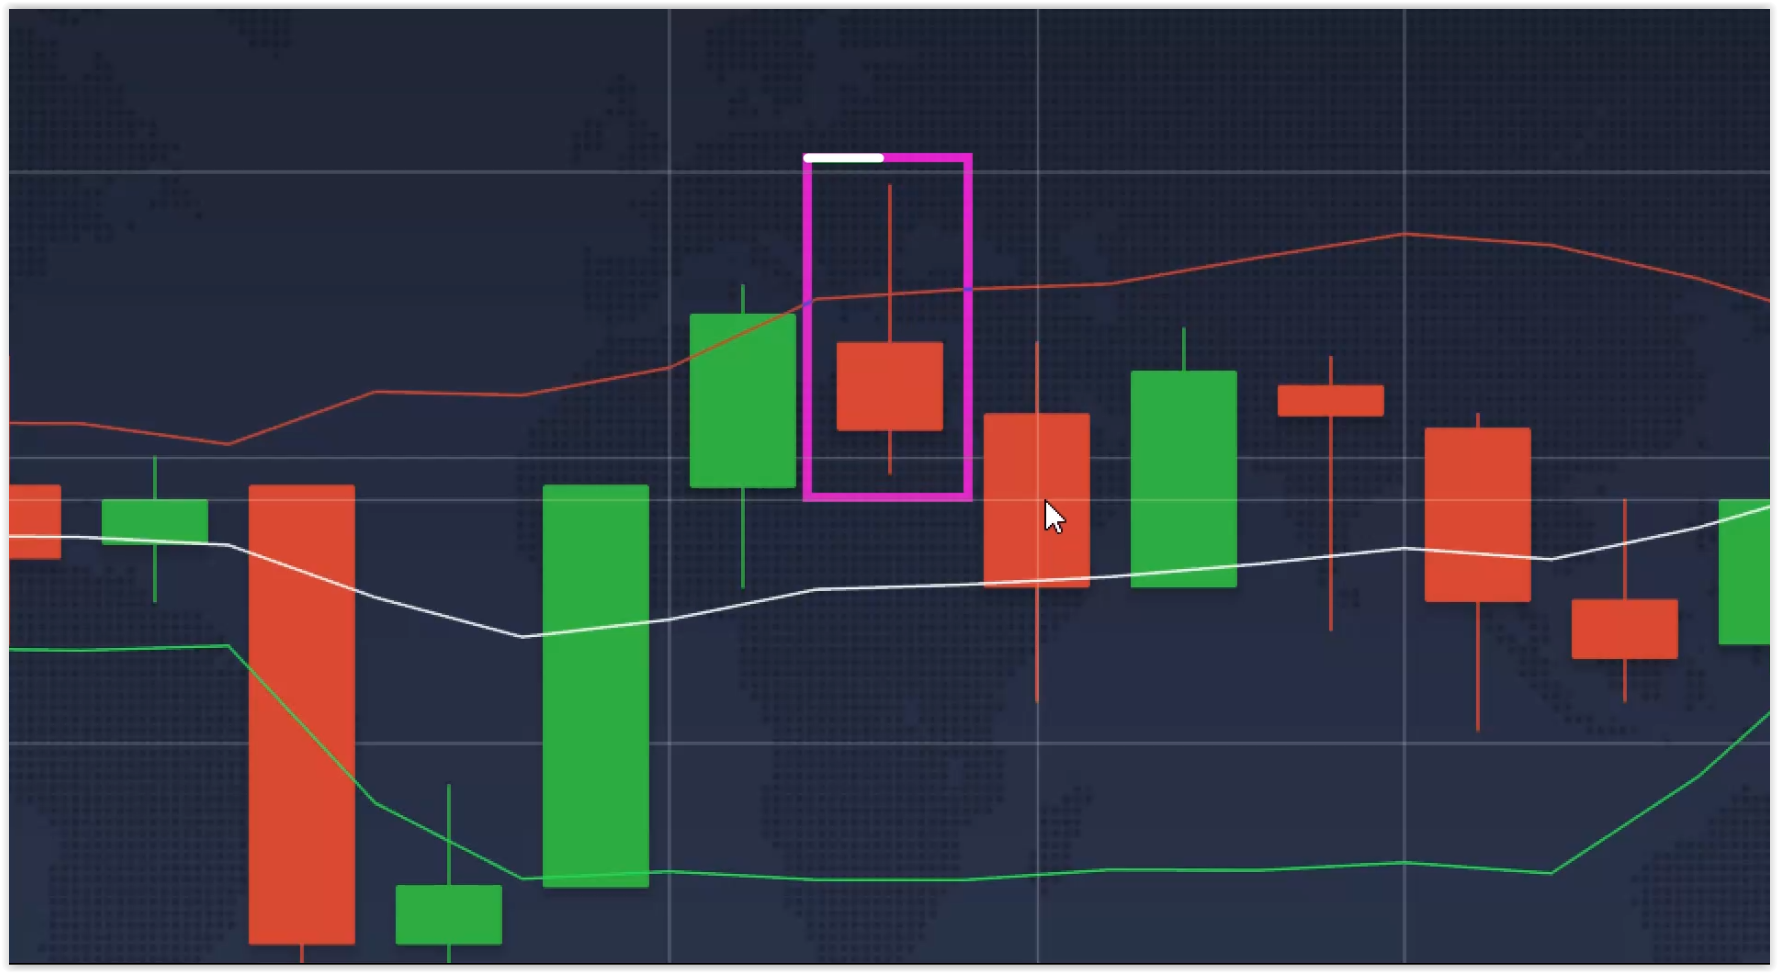
However, I've noticed that many beginners still struggle to identify the "hammer" and lack confidence in their trading.
This has led to the idea of prompting ChatGPT to create an indicator script that allows users to see the "hammer" in real-time during trading sessions.
How to use
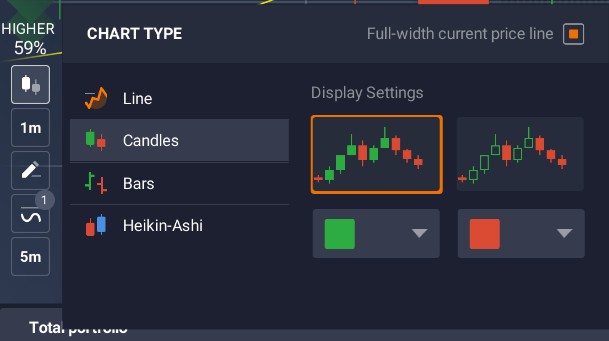
1. Set chart
Set chart to candle sticks
2. Set time frame
Set time frame to 1 minutes
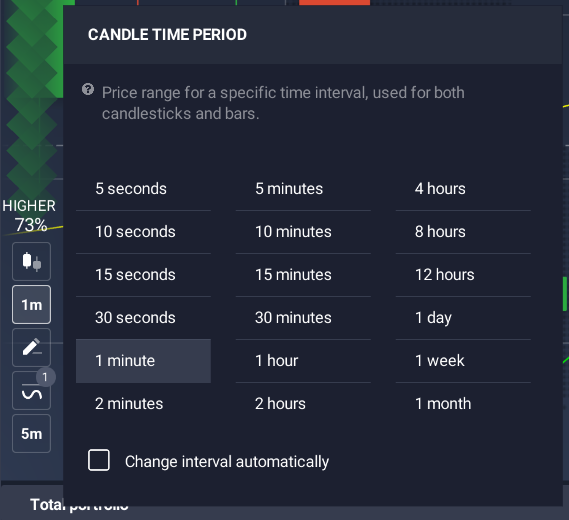
NOTE
Please make sure you NOT select "Change Interval Automatically" to prevent time frame auto change.
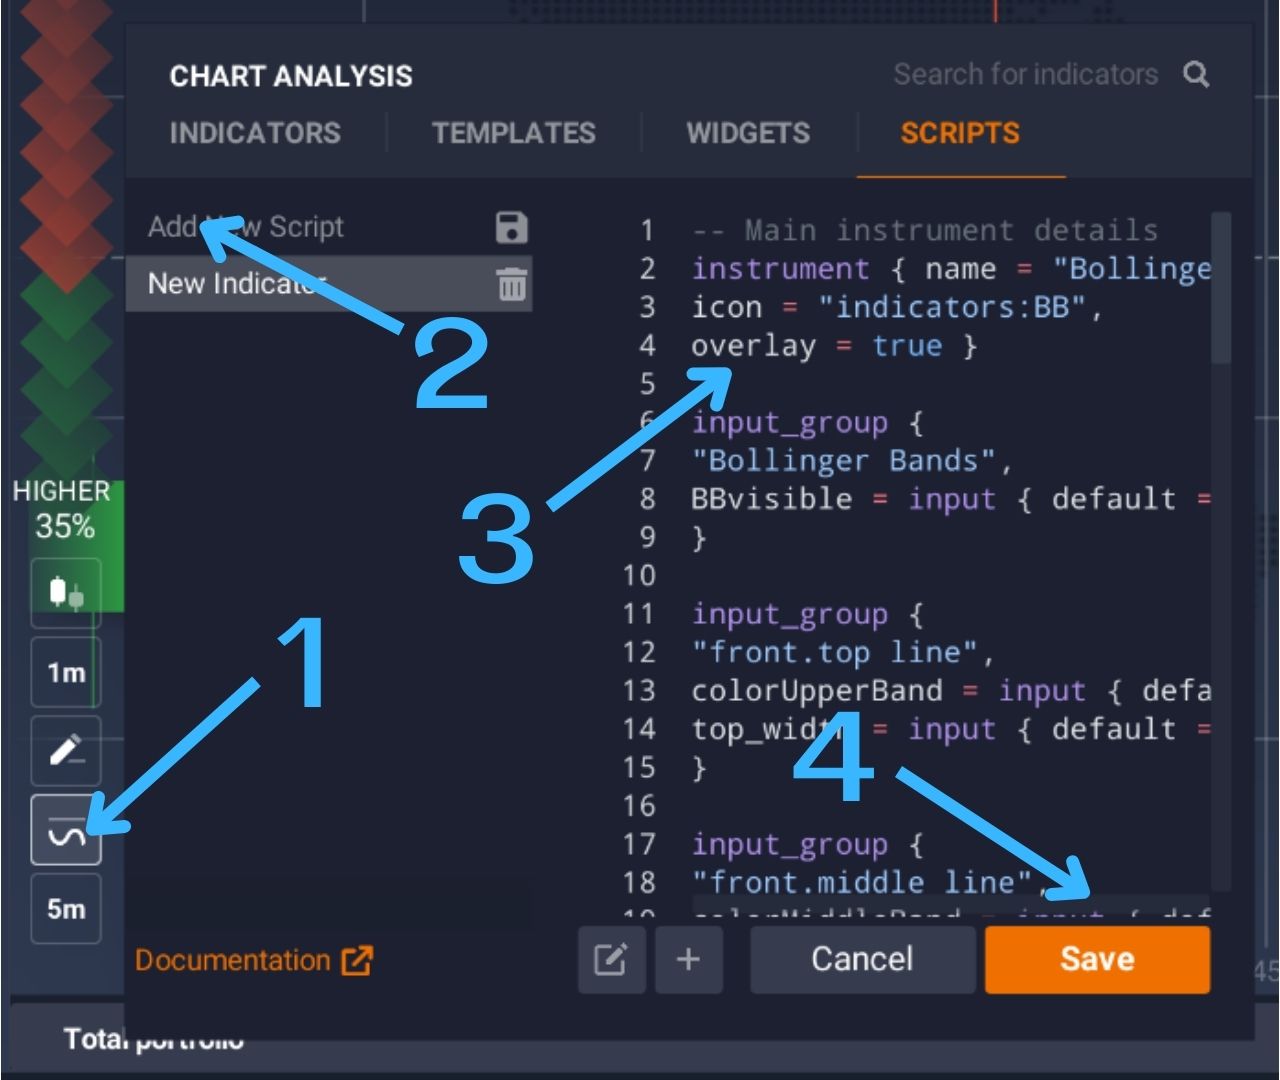
3. Install script
- Click indicator
- Click "add new scirpt"
- Remove old code and Past all script in block code
- Click "Save"
4. Use Script in Chart
- Click "indicator" tab
- Click "Script"
- Select Script "Bollinger Band Follow-up Signal"
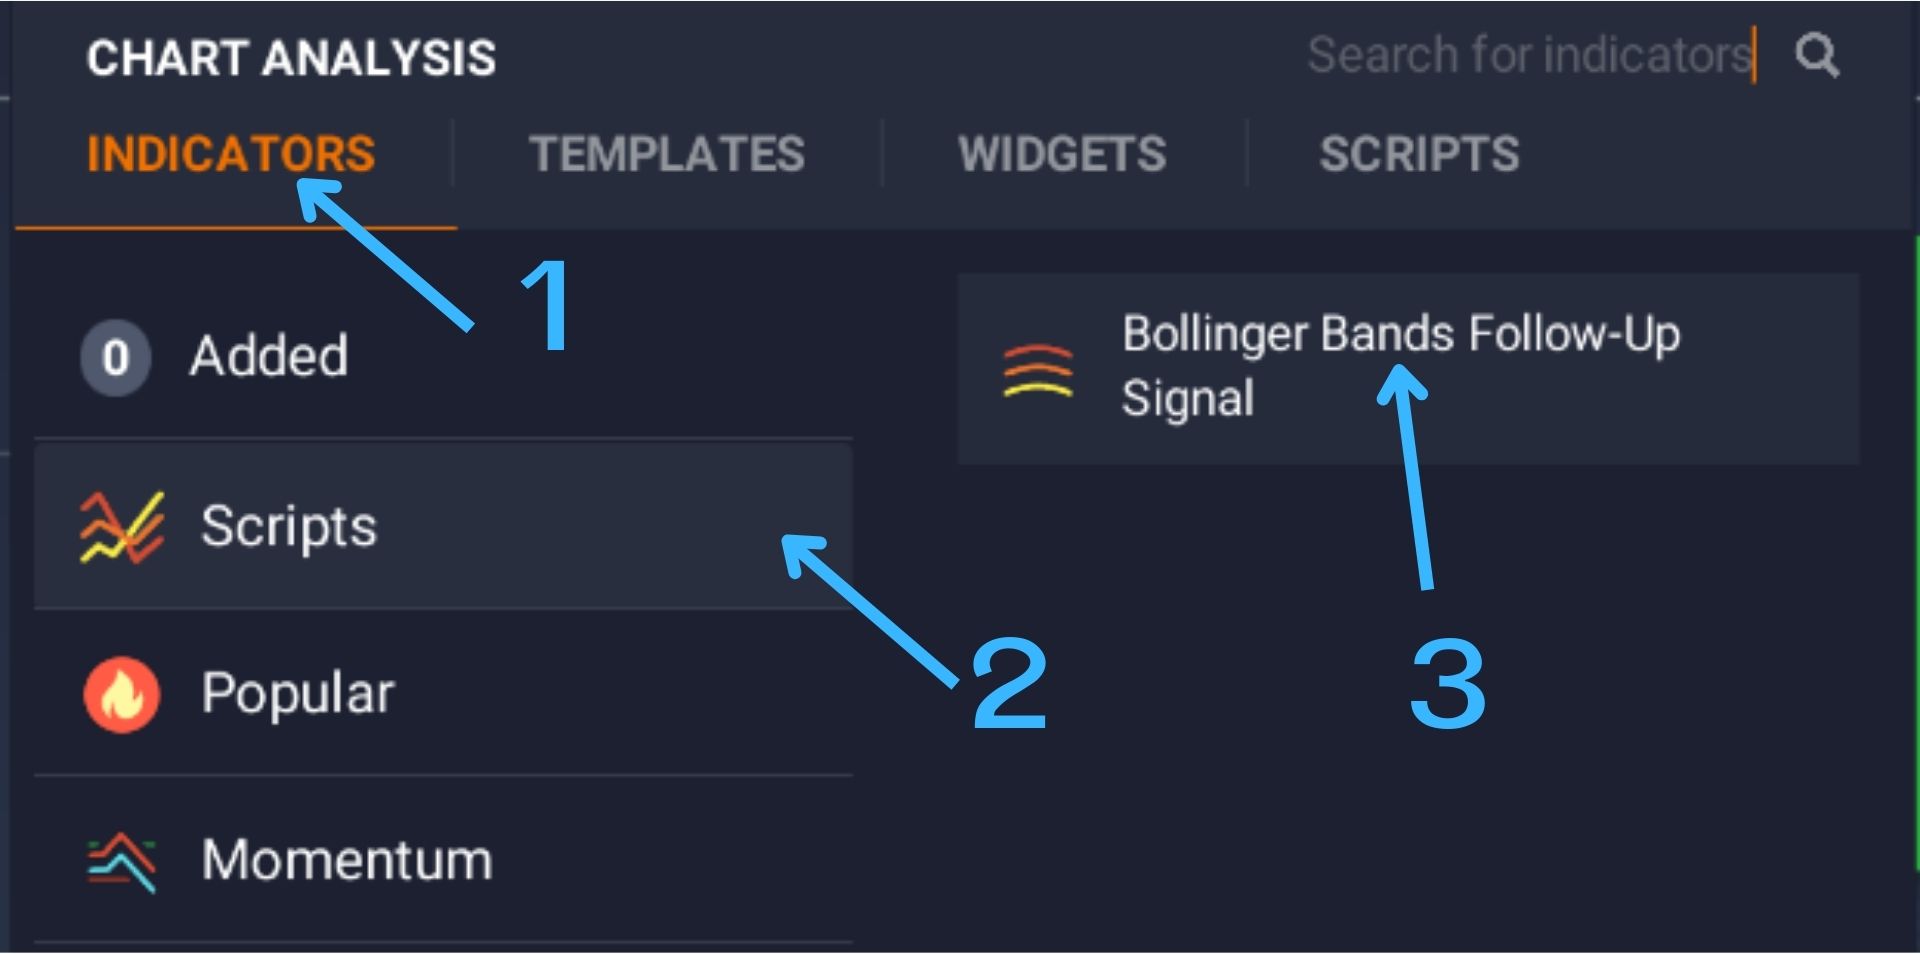
- Click "Apply"
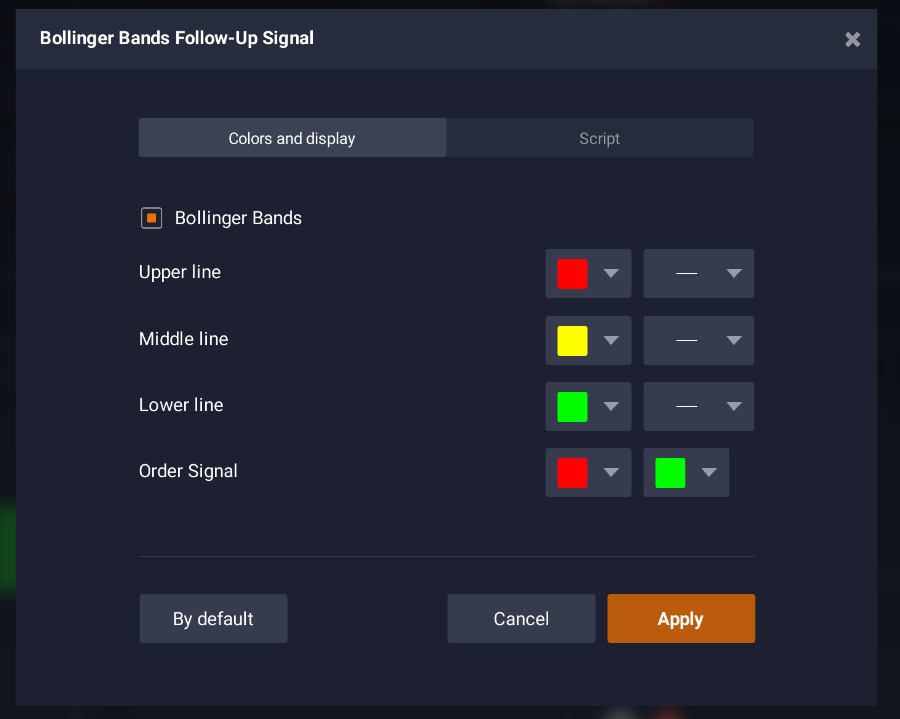
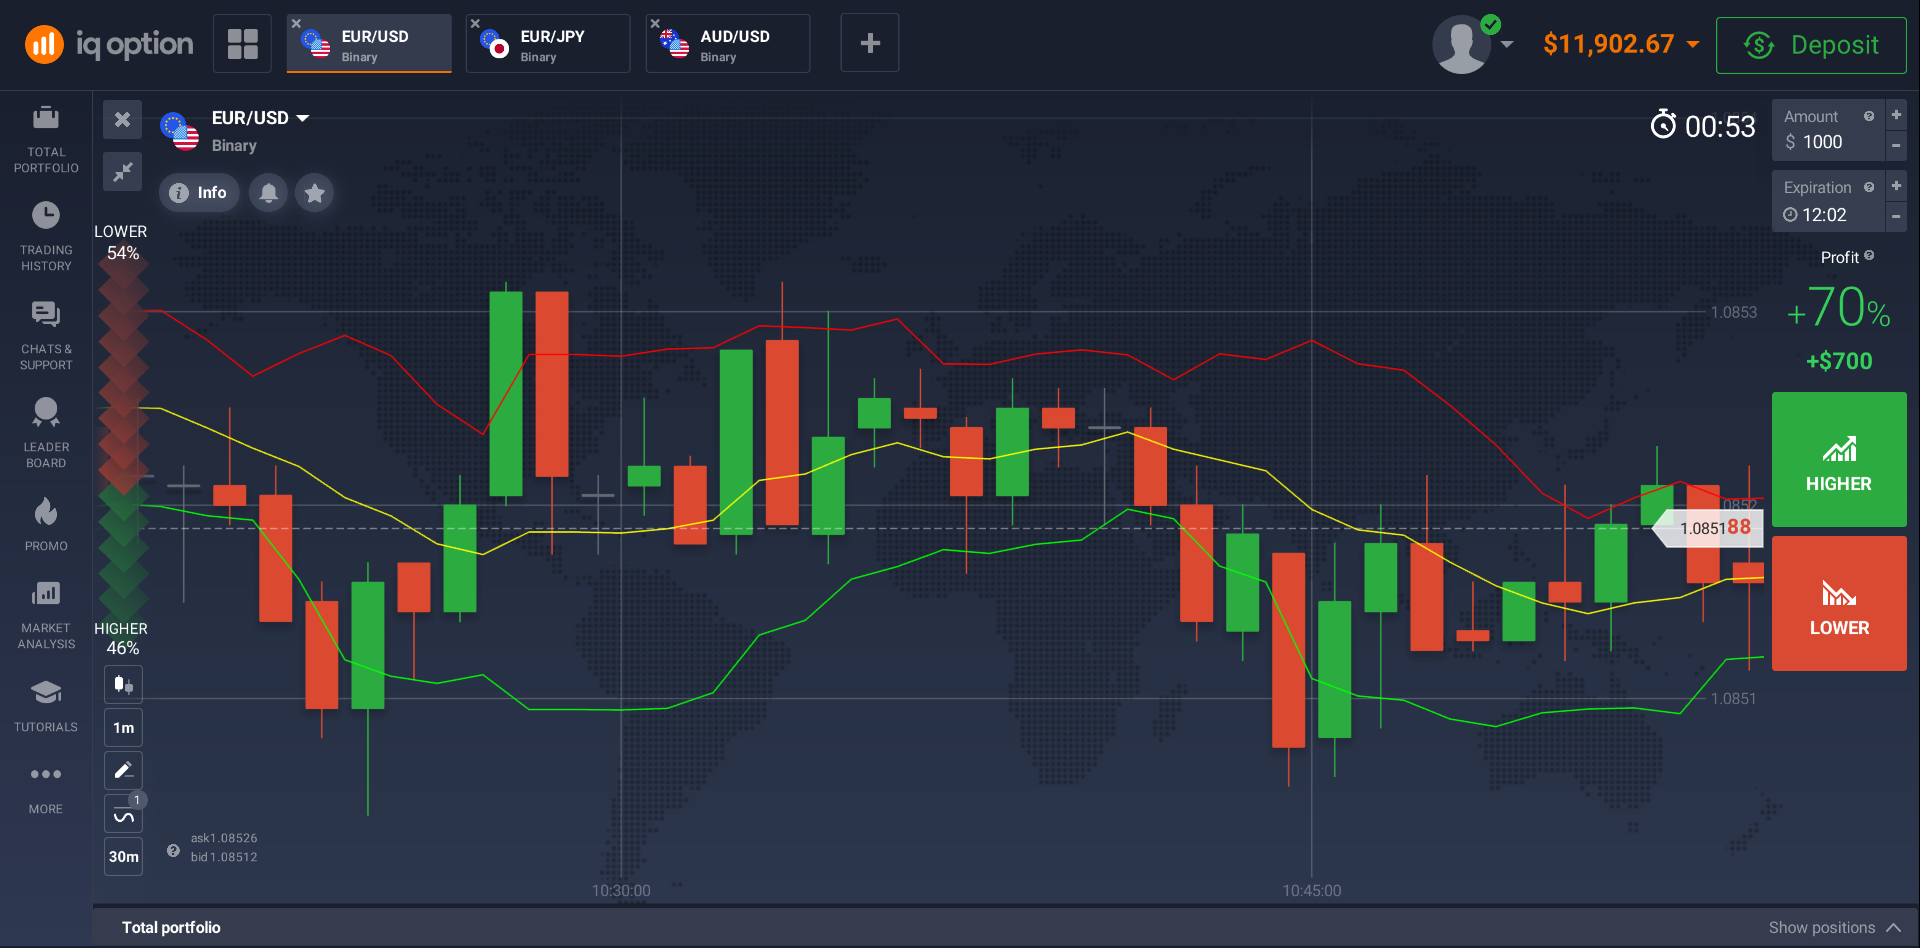
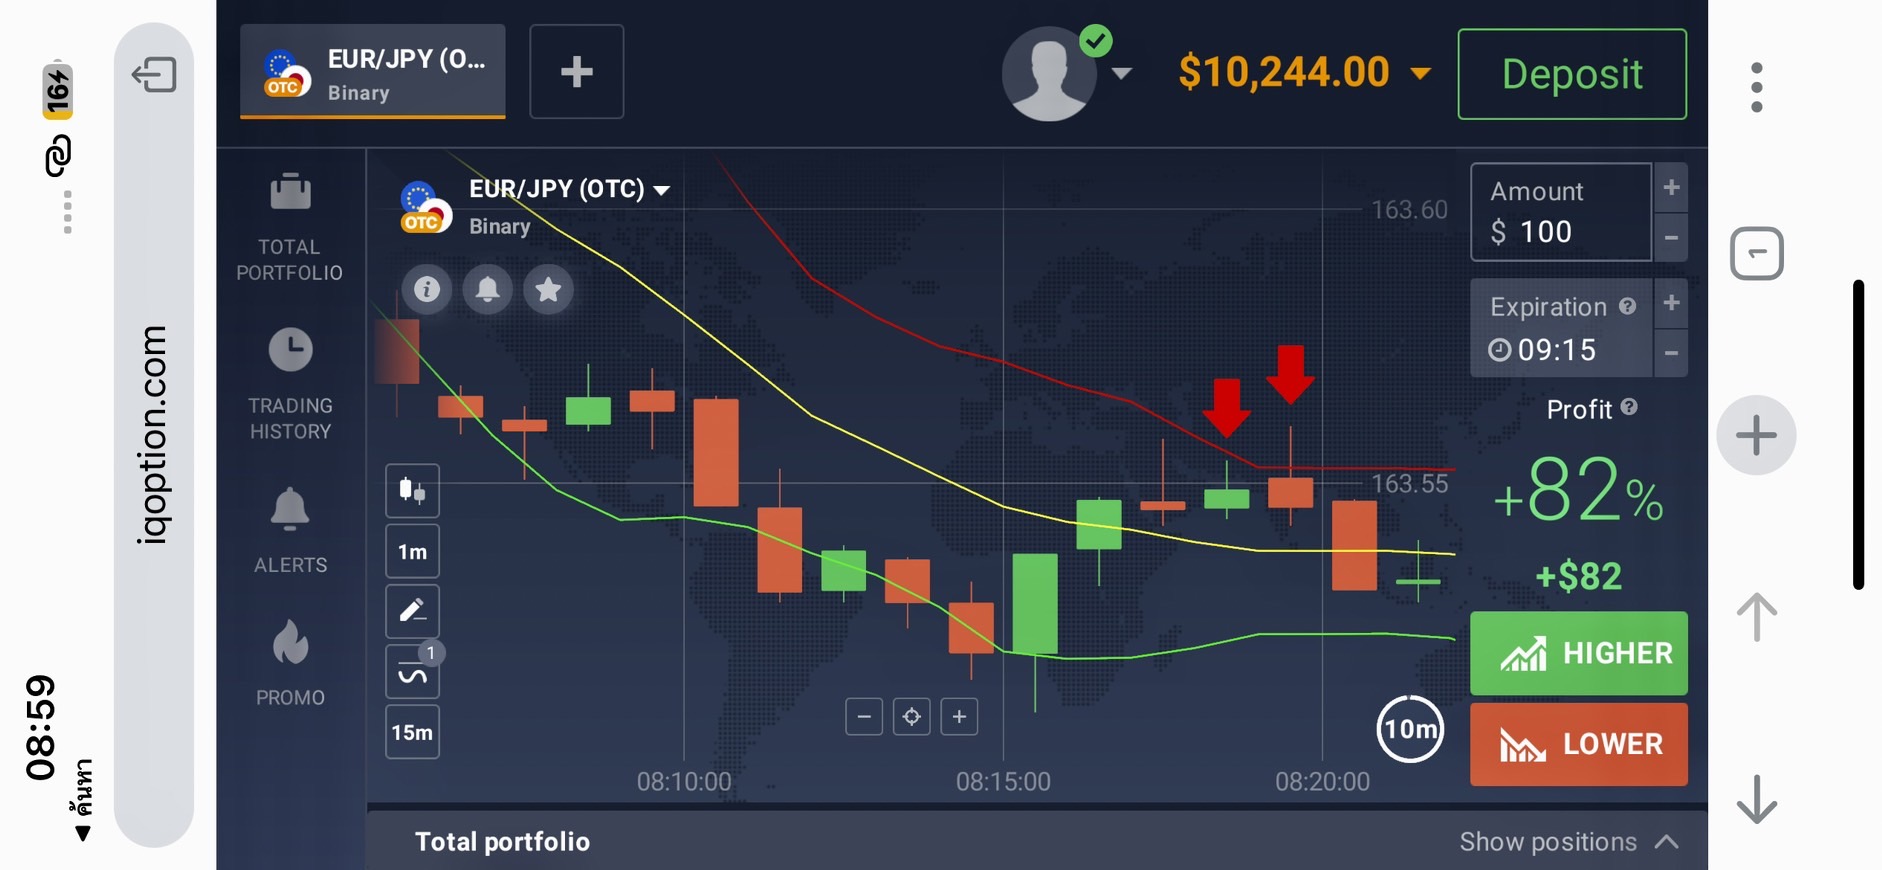
You will see candle and bollinger band 3 lines like this.
4. Order
When the signal appears, click "Buy Up" or "Buy Down" at the start of the next candlestick (at the 30th second).
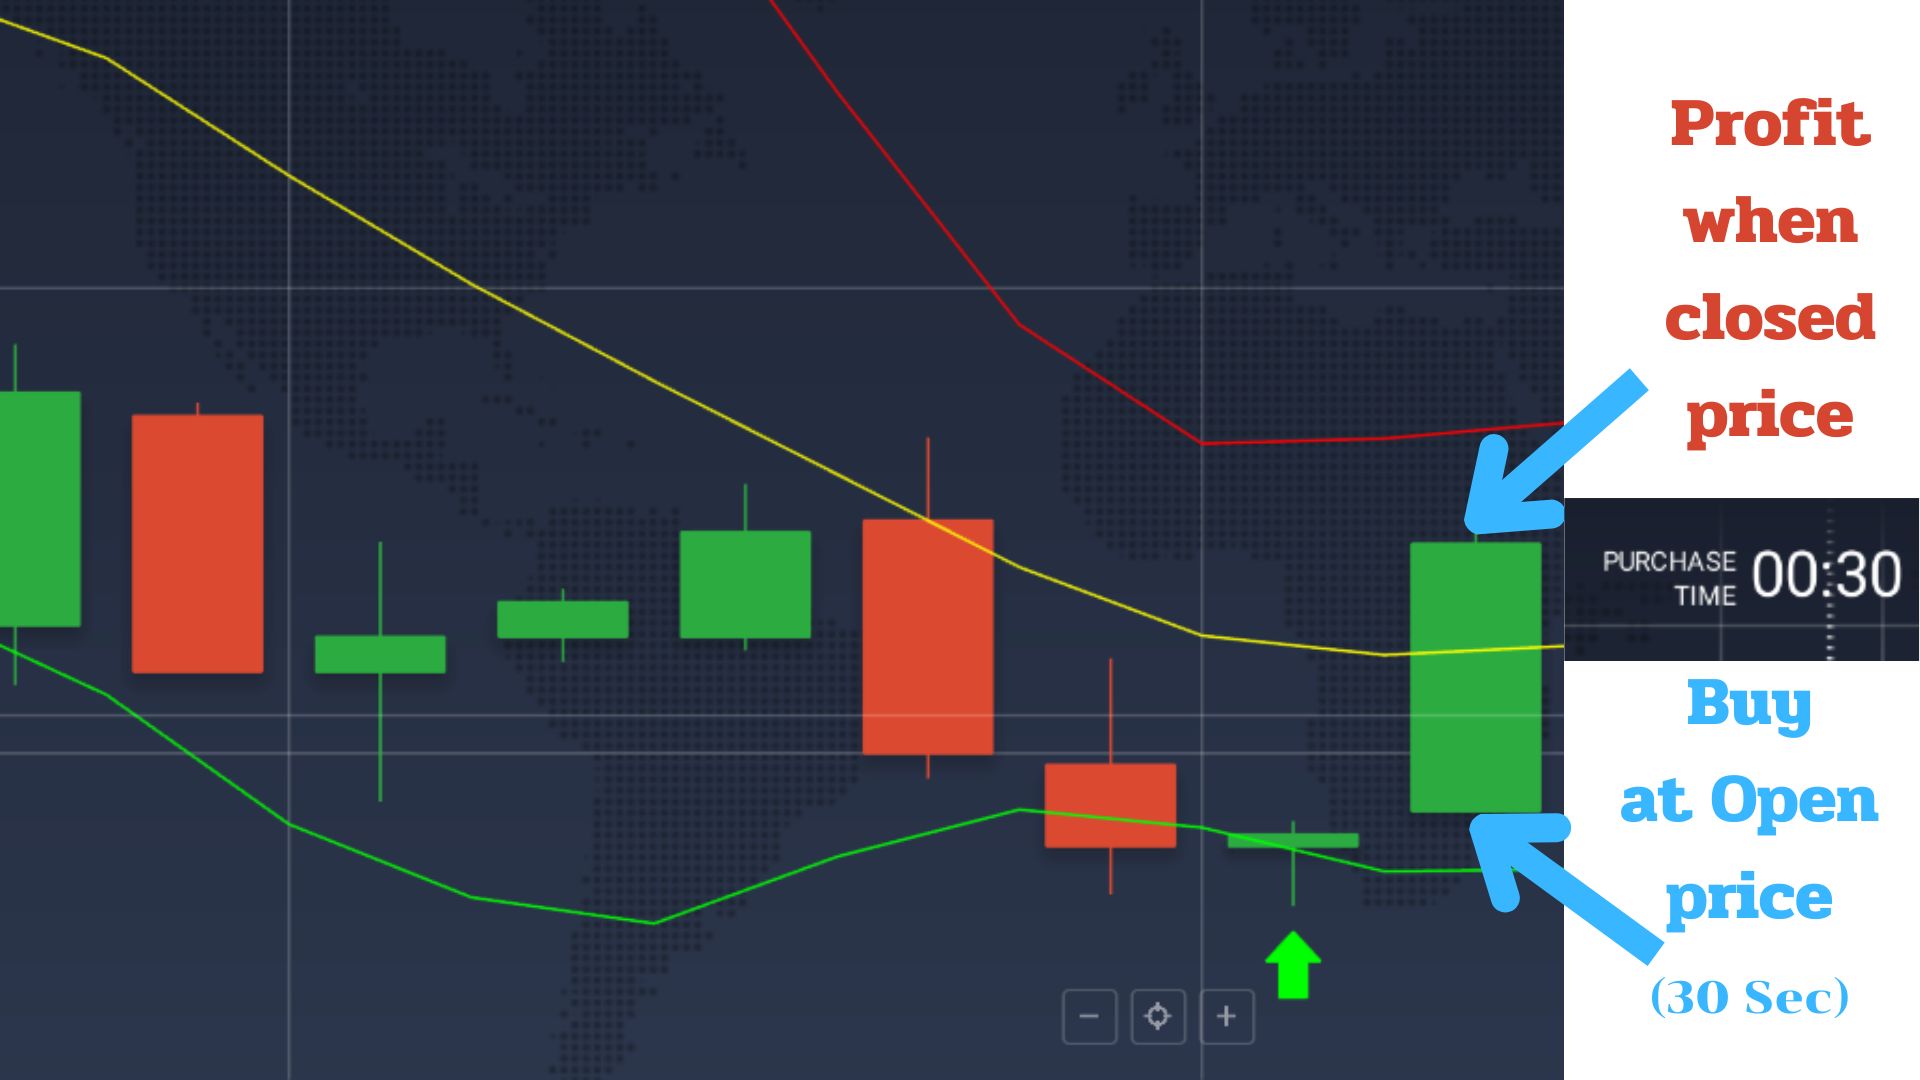
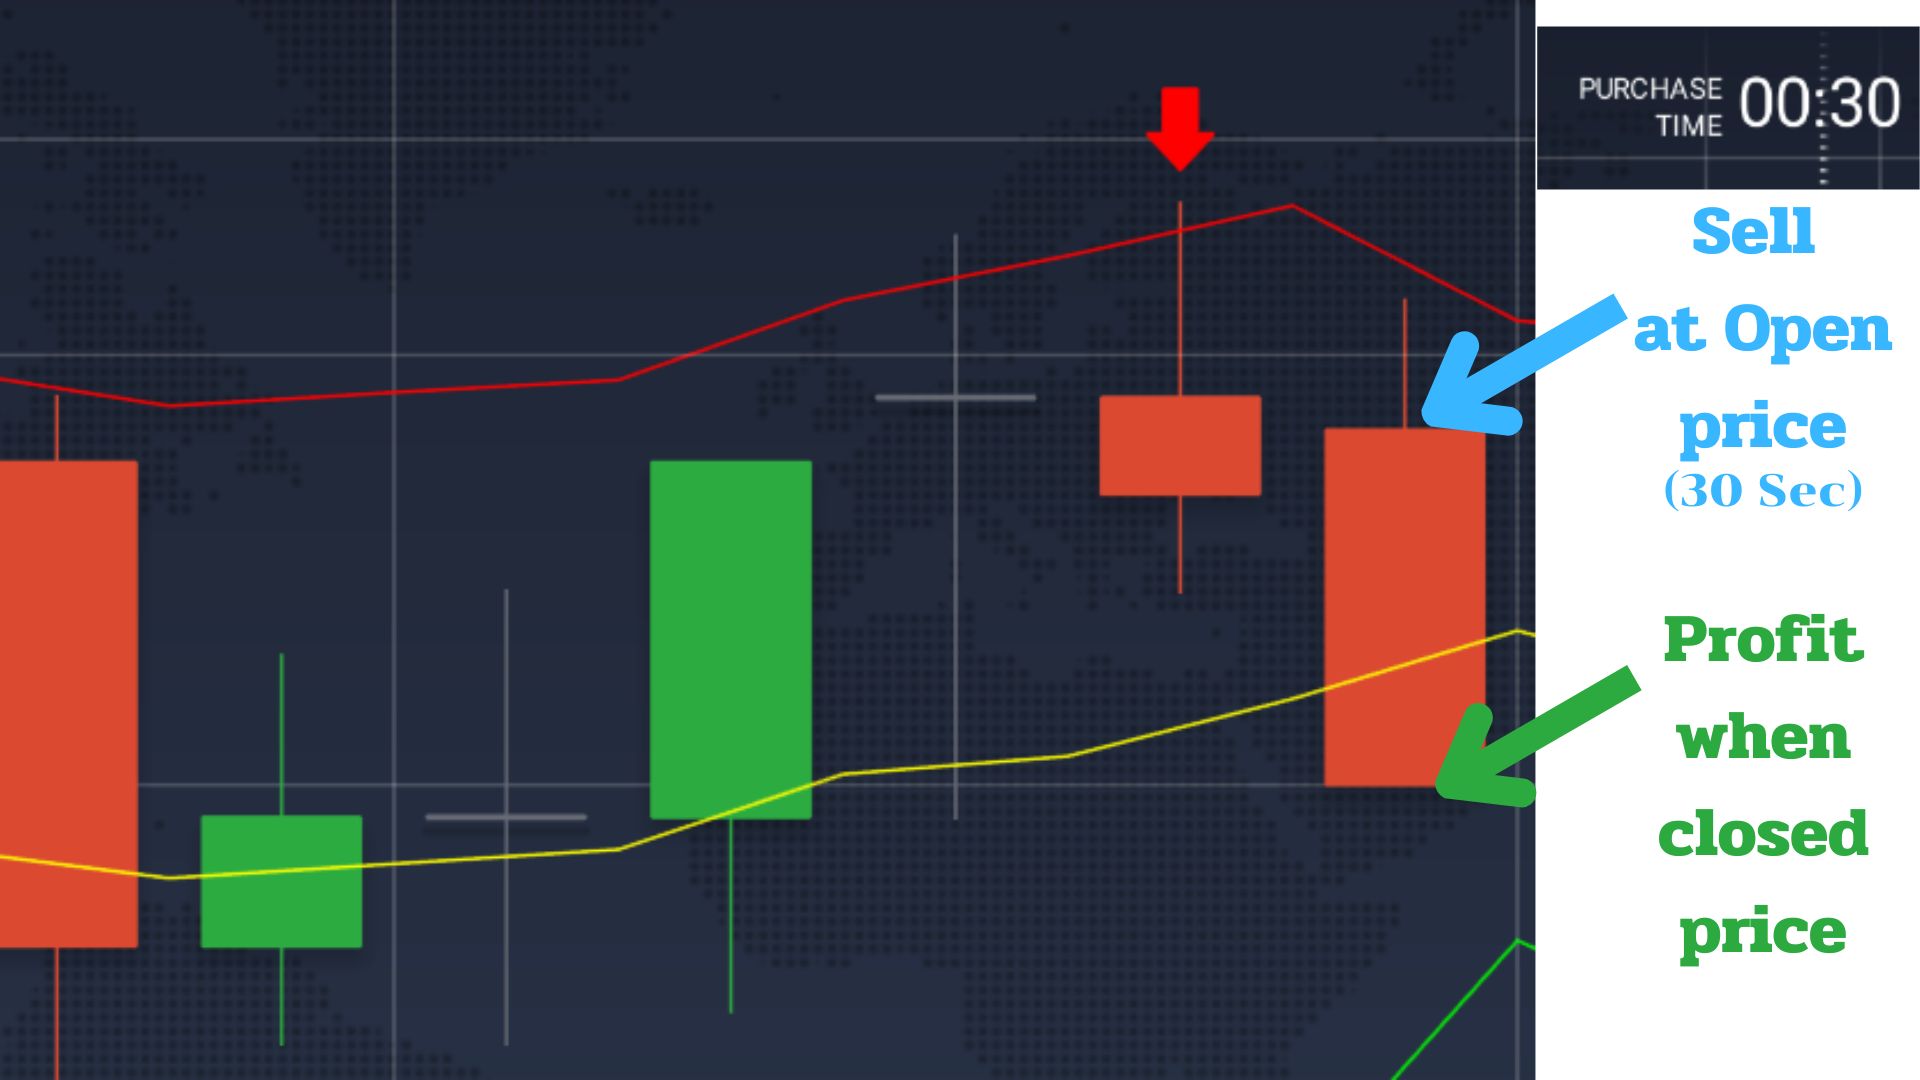
After that, wait 1 minute to see the results.
You can watch the following video to see the steps for installation and the timing for entering orders in detail.
Script
Click the "Copy Code" button at the top right corner of the block below to use it immediately.
-- Main instrument details
instrument { name = "Bollinger Bands Follow-Up Signal",
icon = "indicators:BB",
overlay = true }

input_group {
"Bollinger Bands",
BBvisible = input { default = true, type = input.plot_visibility }
}

input_group {
"front.top line",
colorUpperBand = input { default = "#FF0000", type = input.color },
top_width = input { default = 1, type = input.line_width}
}

input_group {
"front.middle line",
colorMiddleBand = input { default = "#FFFF00", type = input.color },
middle_width = input { default = 1, type = input.line_width}
}

input_group {
"front.bottom line",
colorLowerBand = input { default = "#00FF00", type = input.color },
bottom_width = input { default = 1, type = input.line_width}
}

--------
input_group {
"Order Signal",
color_signale_sell = input { default = "#FF0000", type = input.color },
color_signale_buy = input { default = "#00FF00", type = input.color }
}
-------

period = 9
multiplier = 1.5
source = close

-- Calculating Bollinger Bands
middleBand = sma(source, period)
stdDev = stdev(source, period)
upperBand = middleBand + multiplier * stdDev
lowerBand = middleBand - multiplier * stdDev

-- Plot Bollinger Bands
if BBvisible then
plot(upperBand, "Upper Band", colorUpperBand)
plot(middleBand, "Middle Band", colorMiddleBand)
plot(lowerBand, "Lower Band", colorLowerBand)
end

-- Calculate sell signal conditions
upperWick = high - max(open, close)
lowerWick = min(open, close) - low
bodySize = abs(close - open)
conditionWick = (upperWick > lowerWick) and upperWick > bodySize and bodySize > 0

-- Current bar's Sell Signal condition
current_sell_signal = (open < upperBand and open > middleBand) and (close < upperBand and close > middleBand) and (high > upperBand and low > middleBand) and conditionWick

-- Calculate buy signal conditions
upperWick = high - max(open, close)
lowerWick = min(open, close) - low
bodySize = abs(close - open)
conditionWickReverse = lowerWick > upperWick and lowerWick > bodySize and bodySize > 0

-- Current bar's Buy Signal condition
current_buy_signal = (open > lowerBand and open < middleBand) and (close > lowerBand and close < middleBand) and (low < lowerBand and high < middleBand) and conditionWickReverse

-- Plot current signal

if true then
    plot_shape(current_sell_signal, "Current Sell Signal", shape_style.arrowdown, shape_size.huge, color_signale_sell, shape_location.abovebar, 0, "", color_signale_sell)
    plot_shape(current_buy_signal, "Current Buy Signal", shape_style.arrowup, shape_size.huge, color_signale_buy, shape_location.belowbar, 0, "", color_signale_buy)
end
Using Scripts on Mobile
Thank you for the advice from our channel's follower, a Youtube user named @jirapornjira6520, who helped suggest techniques to enable usage on mobile devices.

The method can be summarized as follows:
- Register and open an account properly (you can follow the link provided by our channel)
- Install the script via a computer as instructed in the clip or this article
- Subscribe to the clip properly
- Open and use it on a mobile device with a web browser; no need to use the app on the store
- Use the script as usual
Disclaimer
IMPORTANT
"Remember, investing involves risks. It's wise to not invest funds you cannot afford to lose."
This script is created solely to facilitate the search for the "hammer" signal. Entering orders or making profits involves techniques that traders must practice and understand the market on their own.
If you're interested in learning about diversifying risks or dividing your investment portfolio, you can check out the video below.
I hope this will be beneficial to all beginners.
Happy Trading!